Michele Mancioppi
on 23 November 2021
Observability vs. monitoring debate: An irreverent view
In the past few years, the word “observability” has steadily gained traction in the discussions around monitoring, DevOps, and, especially, cloud-native computing. However, there is significant confusion about the overlap or difference between observability and monitoring. Instead of providing yet another definition of “What is observability” and “Is observability different from monitoring and why” (you can read what I think about it on the What is observability page), I thought I would have a look at what the rest of the Internet seems to think about it. In this post, I’ll provide a few data points around observability and monitoring based on search term trends, social media, and various blog posts, and argue that the debate around observability vs. monitoring is, at best, poorly understood.
The search engine angle
Poking about in Google Trends over the last decade, you can see that there is a clear spike in the interest in observability around 2019, and the interest keeps growing.

It makes sense: 2019 was around the time open-source distributed tracing began to take hold in the collective consciousness of developers, especially thanks to OpenTracing (now defunct and replaced by OpenTelemetry). An interesting bit here is that distributed tracing has been at the heart of most commercial Application Performance Management tools of the 2010s, from the venerable Introscope to the newer crop of tools, but it took OSS to make distributed tracing really popular.

As a topic, observability is clearly more prominent in North America and a lot of Asia, while monitoring is the topic to search for in Russia and neighbouring countries. Europe is split over it, with Germany and Spain searching predominantly for monitoring, and Italy and Great Britain searching for the observability topic. This split in search terms between observability and monitoring resonates with my experience, especially around the German and USA markets.
The social media angle
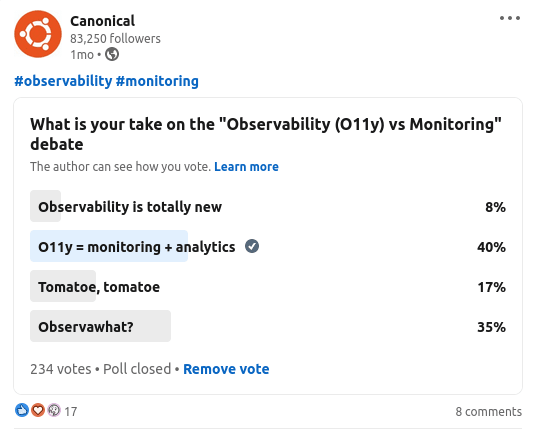
Some time ago, we ran a poll on Twitter and LinkedIn to gauge the take on observability vs. monitoring on social media.


The poll was a bit tongue-in-cheek, and the results show a large disparity in terms of outcome: Twitter went predominantly with the Observawhat? option, while LinkedIn gave Observability is monitoring and analytics slightly more votes than Observawhat?. In terms of interpreting the difference, my take is that LinkedIn, being more a social network aimed at professionals (acting as professionals in a professional capacity), went with the answer in line with much corporate marketing by the observability industry, which has positively inundated that platform. Twitter, instead, went for the “fun” answer, and I love them for it.
Observability tropes
Observability is, put mildly, a very loosely defined term. From the commercial vendor angle (frankly not unsurprisingly and somewhat cynically), pretty much each vendor provides a definition of observability tailored to their current or near-future offering. Nevertheless, there seem to be some major aspects to how one defines observability differently from monitoring. And they are so recurrent that they qualify in my eyes as tropes! (All the pages that I consider are listed in the References section.)
Trope 1: Pillars
The word “pillar” is often used in the observability/monitoring context to represent which types of telemetry are collected and processed by a tool, e.g., metrics, logs, distributed tracing, synthetic monitoring, production profiling, and so on. Some telemetry types are very well understood and widely adopted, such as logs and metrics; others less so, such as distributed tracing, synthetic monitoring and continuous profiling. (Profiling in and of itself is well understood from a development and QA standpoint, but not how to use profilers continuously in production.)
The messaging around monitoring tools tends to focus on particular types of telemetry; specifically, those supported by the tool in question. This is in no small part due to the “land grab” for observability that all major commercial players have undertaken, as commercial observability tools tend to have more encompassing offerings. In reality, there are many types of telemetry, and which ones are needed depends on the particular use case. What there surely isn’t, is a “golden set” of telemetry types that give you just what you need no matter what. The kind of telemetry you need is very dependent on what your application does, who uses it, and how. Of course, the more telemetry types a tool supports, the more likely it can collect what you need. (Also, a very interesting and nuanced discussion that could be had is how the kind of telemetry data needed are related to the knowledge and skill levels of the developers and operators of those apps. But this discussion is one for another day.)
Trope 2: Observability is monitoring plus powerful analytics
Monitoring collects data, and the collected data can be analyzed with means more powerful and flexible than the ones provided by the previous generation of monitoring tools. It is true that, in the past few years, the flexibility of analyzing telemetry has improved by leaps and bounds. How those incremental improvements make a sharp cut between monitoring and observability is honestly beyond me. It is true that, to put it bluntly, it takes a new crop of startups to try something drastically new in the industry (with Dynatrace being arguably the only already established company that created a mostly new tool, initially called Ruxit, in the last decade). But the changes are not such tectonic shifts to justify the fanfare. Some influential voices in the observability community go down to the specific implementation details, like “You pretty much need to use a distributed column store in order to have observability”. I have worked with columnar databases in the scope of an observability tool, and they can be made to work great. But I would not go as far as to say that you cannot “do” observability without one.
Trope 3: Artificial intelligence (AIOps)
This is perhaps my “favourite” trope about observability. It is about an extension of observability, granting the tooling the power to act in an automated fashion on the insights provided by the analysis of telemetry. How well that works in practice depends on how well the observability tooling understands the failure modes, and how reliable are the runbooks that are executed to remediate the issues. And it bears pointing out just how much work “understanding” does in that sentence! I went on record multiple times saying that, more than root cause analysis, observability tooling does root cause fencing: it tells you which errors are occurring, where in your systems they happen, and an approximation of how failures spreads across a system (distributed tracing is not yet a science, especially when it comes to defining the causality between parent and child spans). The interpretation of what leads to what else – or, in other words, the causality between observed phenomena – in most cases still requires a human well-versed in the specifics of the technologies involved.
This is not to say that there is no merit in automatically executing runbooks in response to known issues. For example, scaling up and down applications with well-understood scalability characteristics works just fine. But will an AI manage to analyze unknown problems from the available telemetry and fix it reliably? I frankly don’t see it happening. There is just too much new technology thrown into production every year to even make existing tools understand existing technologies well enough to tackle known failure modes comprehensively.
Conclusions
There seems to be an increasing consensus that observability is more than the monitoring “of yore”. The difference between the two, however, is not clearly understood and the discussion is clearly driven by commercial entities that have vested interests in setting particular offerings aside. There is also, very interestingly, a strong geographical component to the search patterns for observability and monitoring. Nevertheless, at the end of the day, monitoring and observability are terms still mostly interchangeable in the parlance, and it is going to be fascinating to see how the situation evolves in the coming years.
And since we are speaking of observability and how it is evolving, you may want to have a look at the work we are doing around model-driven observability: we are building monitoring stack based on Juju by composing various technologies from the Grafana ecosystem to make the set up for monitoring for your charmed operators absolutely straightforward and raise the bar for making software operable.
References
Very scientifically, I took the first results of a query on DuckDuckGo for “observability vs. monitoring”. (With Google, the results shown would have been influenced by my past as Product Manager at Instana.) The material about “observability vs. monitoring” used as reference in this post is the following, in order of search result:


